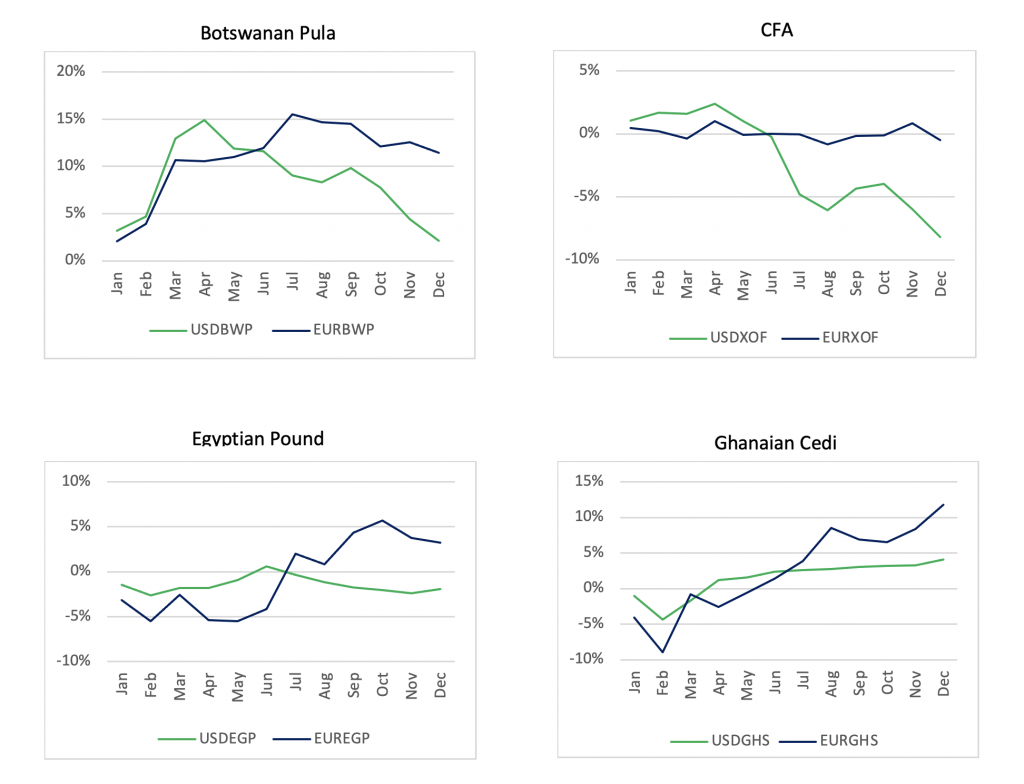
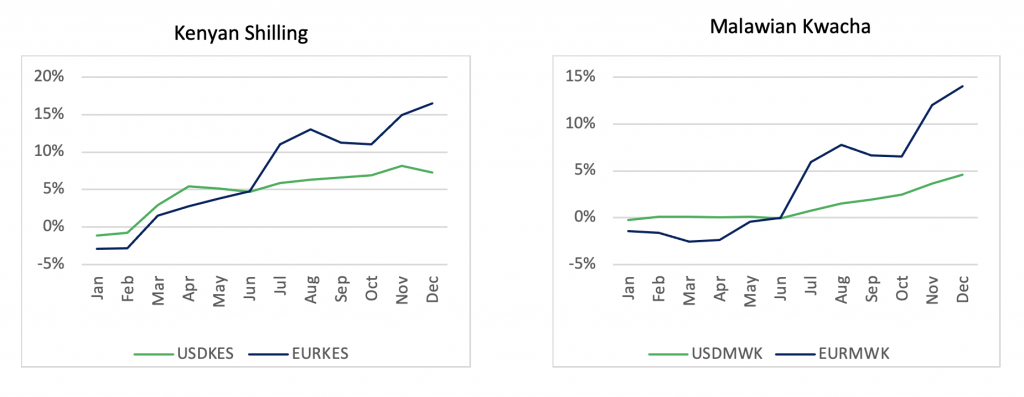
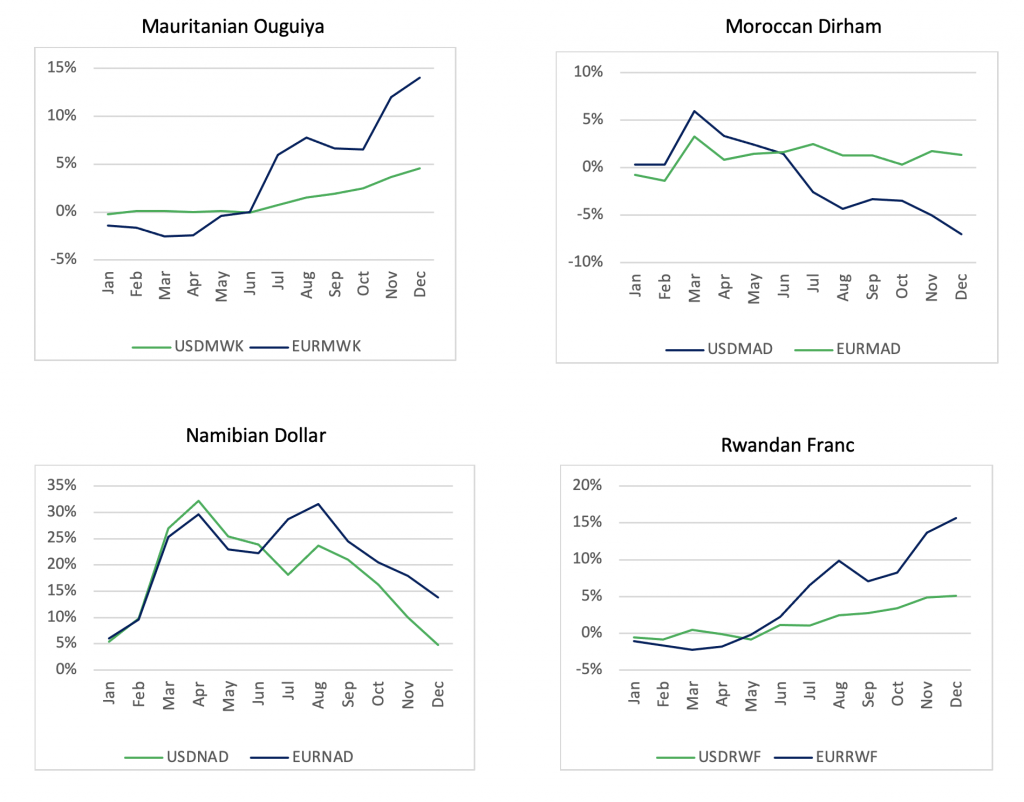
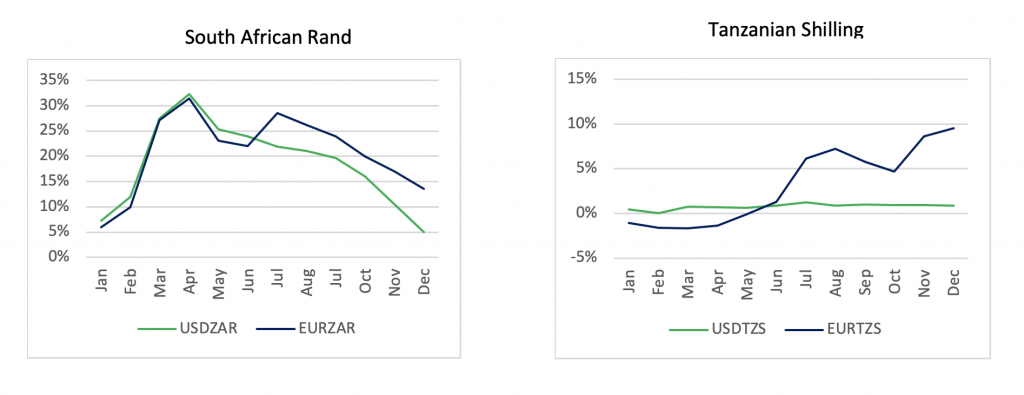
It’s been a volatile stretch for the currency market in 2020 following the general slowdown in economic activities resulting from the COVID-19 pandemic. In this article, Tesah Capital analyzed the performance of sixteen (16) currencies on the Africa continent.
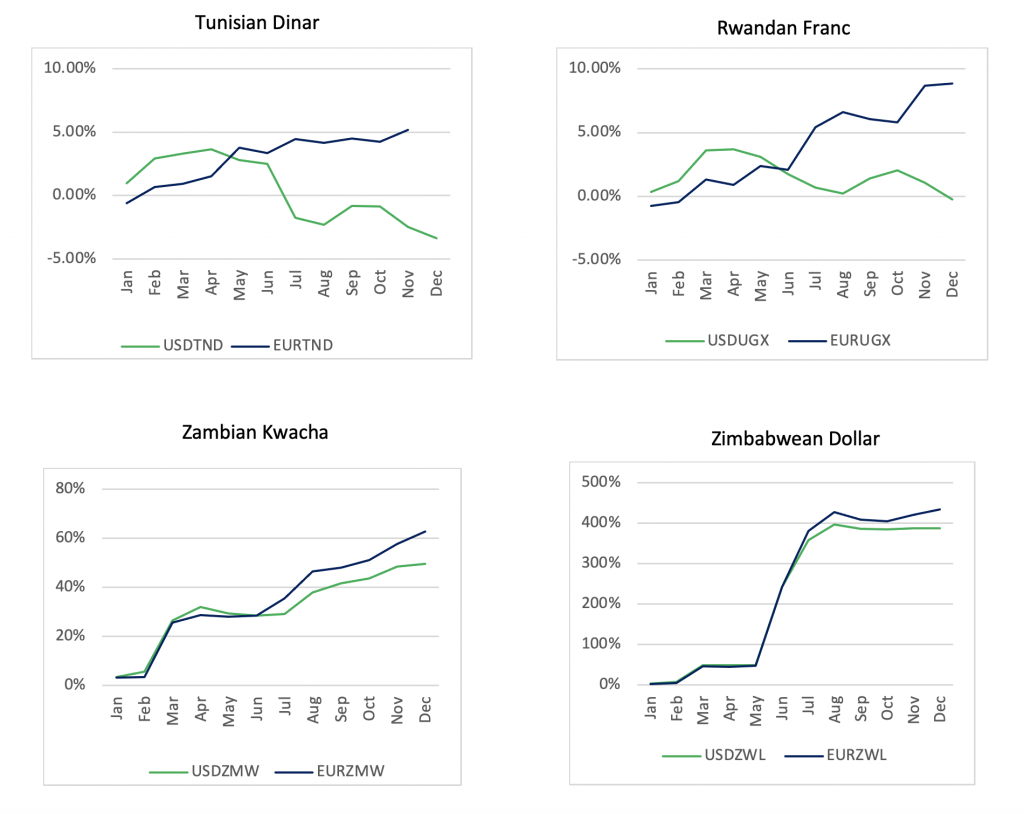
The Ivory Coast’s CFA against the Dollar averaged USD/XOF 574.45 throughout the year at a YTD appreciation rate of 9.03%, making it one of the best performing currencies in Africa. This is followed by the Moroccan Dirham, the Tunisian Dinar, the Egyptian Pound ad the Ugandan Shilling, which appreciated by 7.03%, 2.95%, 1.95%, and 0.25% against the USD respectively.
On the other hand, the currencies of other African economies (Zimbabwean RTGS, Zambian Kwacha, Nigerian Naira) depreciated sharply against the USD. These currencies shed more than 20% of their values during the period under review (please see Table 1 below for more details).
Data in Table 1 as at December 31, 2020 revealed, the Mauritian Rupee had depreciated against the United States Dollar by 9.22%; the Kenyan Shilling had depreciated by 7.31%, Rwandan Franc by 5.10%, South African Rand by 4.96%, Malawian Kwacha by 4.57%, Turkish Lira Botswana Pula by 2.11%, and the Tanzanian Shilling by 0.91%. Notwithstanding the devastating effect of the pandemic on the Ghanaian economy, the Ghana Cedi depreciated by 4.09% compared to 14.81% in 2019.
Below are the exchange rate performance selected Africa countries as at December 31, 2020:
Table 1:
| Currency | Code | Last (1 USD) | YTD | Rank |
| Ivory Coast | XOF | 536.97 | -9.03% | 1 |
| Moroccan Dirham | MAD | 8.89 | -7.03% | 2 |
| Tunisian Dinar | TND | 2.72 | -2.95% | 3 |
| Egyptian Pound | EGP | 15.73 | -1.95% | 4 |
| Ugandan Shilling | UGX | 3,655.26 | -0.25% | 5 |
| Tanzanian Shilling | TZS | 2,318.54 | 0.91% | 6 |
| Botswana Pula | BWP | 10.8 | 2.11% | 7 |
| Ghana Cedi | GHS | 5.76 | 4.09% | 8 |
| Malawian Kwacha | MWK | 770.41 | 4.57% | 9 |
| South African Rand | ZAR | 14.69 | 4.96% | 10 |
| Rwandan Franc | RWF | 990.81 | 5.10% | 11 |
| Kenyan Shilling | KES | 109.17 | 7.31% | 12 |
| Mauritian Rupee | MUR | 39.70 | 9.22% | 13 |
| Nigerian Naira | NGN | 379.00 | 23.86% | 14 |
| Zambian Kwacha | ZMW | 21.17 | 49.59% | 15 |
| Zimbabwean RTGS | ZWL | 81.79 | 387.60% | 16 |
African Currencies Performance against the US Dollar (USD) and Euro (EUR) in 2020
